
Ask what the Cape of Good Hope costs instead of Suez and you will be given a number. Ask where that number came from and it is usually a distance with no cost attached, a cost with no emissions exposure in it, or a transit time lifted from a different trade lane.
The honest answer is more complicated than a toll against a fuel bill. It varies enormously by destination, two of the largest cost lines sit outside freight entirely, and only one intergovernmental body has published a like-for-like comparison of the two routings. Everything else has to be assembled, which is what this guide does.
This guide gives the verified distances and days lane by lane, explains how a Suez toll is calculated, prices the Cape alternative, gives the official comparison per container, and covers the emissions cost most comparisons leave out.
Carra Globe provides importer of record and exporter of record services, so we have a commercial interest in your answer. What follows is written to be usable whether or not you ever speak to us.
Distance and days, lane by lane
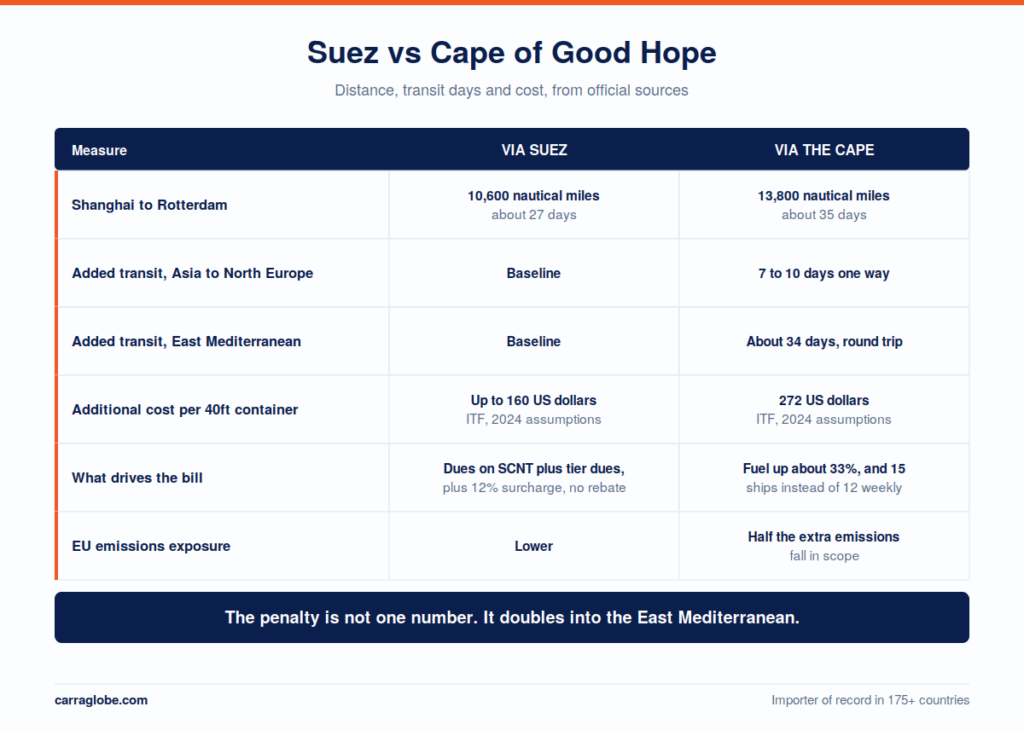
How many days does the Cape of Good Hope add? Published comparisons put the pure sailing penalty on Shanghai to Rotterdam at seven to ten days one way. Once port calls and service patterns are included, seven to twelve is the more realistic planning range. On Asia to the Mediterranean it is materially more, and on East Mediterranean services it can be roughly double the North Europe figure. There is no single number that works for every lane, and anyone quoting one has borrowed it from somewhere else.
The cleanest published pair is from Port Economics, Management and Policy, calculated at 16 knots with no port calls.
| Lane | Via Suez | Via the Cape | Difference |
|---|---|---|---|
| Shanghai to Rotterdam | 10,600 nautical miles, about 27 days | 13,800 nautical miles, about 35 days | Roughly 3,200 nautical miles, about 8 days |
| Shanghai to New York | 12,400 nautical miles, about 32 days | 14,500 nautical miles, about 38 days | Roughly 2,100 nautical miles, about 6 days |
| Singapore to Rotterdam | 8,440 nautical miles, commonly published | Roughly 11,900 nautical miles, derived | Roughly 3,450 nautical miles, about 41 per cent further |
The Singapore row needs its arithmetic stated. UNCTAD’s published wording is that a container shipped from Singapore to Rotterdam “sees the journey cut by 29 per cent when using the Suez instead of the Cape of Good Hope”. Measured the other way round, from the Cape, that is about 41 per cent further, not 29. Applying it to the commonly published 8,440 mile Suez distance gives roughly 11,900 nautical miles via the Cape. The Suez figure is published; the Cape figure is derived from UNCTAD’s percentage.
Other institutions land in a similar band with different assumptions. The World Bank puts the Asia to Europe penalty at 3,000 to 3,500 nautical miles and seven to ten days. The International Transport Forum works in round trips and puts it at about 8,500 nautical miles and twenty days, which is roughly ten days each way.
Two things to take from that spread. The published sailing penalty on Asia to North Europe runs seven to ten days one way, and for planning across a range of services seven to twelve is the safer assumption. And the port-to-port numbers above are clean sailing times: a real Asia to Europe rotation with five to ten port calls runs longer than either column suggests.
Why the Mediterranean penalty is bigger
This is the part that gets copied wrong most often. A Cape-routed ship bound for the Mediterranean rounds southern Africa, continues north through the Atlantic to Gibraltar, then reverses direction eastward into the Mediterranean. The relative penalty is therefore materially larger than on a North Europe service.
Sea-Intelligence measured minimum transit times against a pre-crisis baseline and found Asia to North Europe up about 15 per cent, Asia to the Mediterranean up about 39 per cent, and East Mediterranean port pairs up 61 to 63 per cent. Baltic services moved least, at 7 to 11 per cent.
Peer-reviewed work published in Transportation Research Part A in January 2026 reached the same conclusion from vessel tracking data, measuring round trip durations rather than port pairs.
| Round trip | Via Suez | Via the Cape | Additional days |
|---|---|---|---|
| Asia to West Europe | 91.7 days | 111.7 days | About 20 days |
| Asia to West Mediterranean | 96.2 days | 117.3 days | About 21 days |
| Asia to East Mediterranean | 85.7 days | 119.9 days | About 34 days |
Do not reuse the North Europe number for a Mediterranean shipment. An East Mediterranean round trip gains roughly 34 days on the Cape against about 20 for West Europe. If your planning assumption came from a Rotterdam comparison and your cargo is going to Piraeus, Mersin or Alexandria, you are working from a figure that understates the penalty by a wide margin.
One honest gap. We could not find a credible published nautical mile pair for any Asia to Mediterranean lane from a source we would rely on. The asymmetry is well documented in days and percentages, not in miles, so this guide does not invent the miles.
What a Suez transit actually costs, and why the figure is hard to quote
Suez dues are not charged on containers, deadweight or the tonnage on a ship’s certificate. They are charged on Suez Canal Net Tonnage, a system unique to the canal that still applies nineteenth-century principles, a century older than the international tonnage convention.
- The basis is SCNT, not TEU. A vessel’s Suez Canal Net Tonnage is established through the canal’s own tonnage certification system and is what the dues are calculated on.
- The scale is regressive. Container ships sit at Rate 7 of the transit dues schedule, priced in special drawing rights per ton across successive bands, with each band cheaper than the last, and separate laden and ballast columns.
- Deck-stowed containers are charged separately. Containers carried on the weather deck attract additional container tier dues alongside the tonnage-based charge, so two ships of the same SCNT can pay differently depending on how they are stowed.
- A temporary surcharge sits on top. Suez Canal Authority circular 2 of 2026 set a temporary 12 per cent surcharge for laden and ballast container ships in either direction, applying to transits from 15 July 2026. The same round raised other classes far more steeply, with laden crude tankers at 37 per cent and bulk carriers at 22 per cent.
So the bill stacks: tonnage-based dues on the regressive scale, plus additional dues for deck-stowed container tiers, plus the temporary 12 per cent, and no rebate. The base tariff itself has not moved since 15 January 2024. What has changed in 2026 is everything around it.
The authority introduced a 15 per cent rebate for container ships of 130,000 SCNT and above under circular 3 of 2025, applied automatically on transit with no application required. It was extended twice, the second extension taking its planned validity to 30 June 2026. The authority nevertheless suspended it early, effective 7 April 2026. So a large container ship transiting today pays no rebate and a 12 per cent surcharge, on an unchanged base tariff.
We are not publishing a headline dollar figure for a single transit, because the calculation is vessel-specific. It needs the vessel’s SCNT with the applicable band and surcharge, and SCNT is not the tonnage printed in a ship’s specification. The authority publishes a toll calculator, but no reliable number follows from headline TEU capacity alone. Published estimates for large container ships run from a few hundred thousand dollars to well over a million, and the gap between them is an assumption rather than a fact.
What the Cape costs instead
Avoiding the toll is not free. The International Transport Forum priced the alternative on a 12,500 TEU vessel at 80 per cent load, burning around 100 tonnes of fuel a day.
- Fuel. About 2,000 tonnes more per round trip, which the forum costed at roughly one million dollars, an increase of about 33 per cent, holding speed constant.
- Ships. Fifteen vessels instead of twelve to maintain a weekly Far East to Europe service, a 25 per cent increase in deployed tonnage for the same sailing frequency. On a shorter loop the effect is smaller: UNCTAD’s India to Europe example goes from 56 days and eight vessels to 63 days and one more ship.
- Time. Around twenty additional days of charter and container hire per round trip.
- Emissions. At constant speed the fuel effect is about a third. UNCTAD put the greenhouse gas increase at over 70 per cent for a Singapore to Northern Europe round trip, because carriers speed up to protect the schedule, and a one per cent speed increase raises fuel consumption by about 2.2 per cent.
That last point is the one most comparisons miss. The gap between a 33 per cent fuel increase and a 70 per cent emissions increase is not a disagreement between sources. It is the difference between sailing the same speed for longer and sailing faster to arrive on time.
The system-wide effect is visible in UNCTAD’s own numbers. The average voyage haul rose from 4,831 nautical miles in 2018 to 5,245 in 2024, and tonne-mile demand grew 5.9 per cent in 2024 against volume growth of only 2.2 per cent. The World Bank estimated that the longer route absorbed between 700,000 and 1.9 million TEU of capacity.
The one official comparison, per container
The International Transport Forum, part of the OECD, published the only like-for-like total cost comparison of the two routings that we could find from any intergovernmental or official body. If a newer one exists, we did not locate it.
| Routing | Additional cost per voyage | Per 40ft container |
|---|---|---|
| Via Suez, carrying the toll and war risk premium | Up to 1 million US dollars | 160 US dollars |
| Via the Cape of Good Hope | 1.7 million US dollars | 272 US dollars |
Its stated assumptions are a 12,500 TEU vessel at 80 per cent load, 100 tonnes of fuel a day, 50,000 dollars a day in charter, 300,000 dollars in container hire, and 80 per cent of round trip costs assigned to the westbound leg.
Read the date before you use the numbers. That comparison was struck in 2024, and three of its inputs have moved in one direction since. The 15 per cent Suez rebate has gone, a 12 per cent container surcharge has been added, and the EU emissions exposure described below has moved from 40 per cent of reported emissions to 100 per cent. Bunker prices and war risk premiums have moved in both directions. The shape of the comparison holds and the Suez side of it has got more expensive, but the absolute figures are two years old and no newer official version exists.
What the shape tells you is useful on its own. The routing decision is worth something like 112 dollars per forty foot container on these assumptions, which is real money on a large deployment but far smaller than the freight rate swings that accompanied the diversion. Our note on why your freight bill comes in higher than your contract covers the difference between the cost of a routing and the price you are quoted for it, and comparing DDP quotes for IT equipment sets out what to hold constant when two quotes disagree.
The EU emissions cost most routing comparisons miss
If your cargo is bound for Europe, the routing decision has a carbon price attached to it, and this is missing from essentially every comparison published on the subject.
Shipping entered the EU Emissions Trading System in 2024. It applies to ships of 5,000 gross tonnes and above calling at or departing from ports in the European Economic Area, whatever flag they fly. Voyages between two EEA ports and time at berth count in full. Voyages that start or end outside the EEA count at 50 per cent.
- The extra Cape distance falls on the international leg, which is in scope at 50 per cent, so the Cape increases the exposure by half of the additional emissions rather than all of them.
- The intra-European legs do not change, because the ship still calls at the same ports in the same order.
- Carbon dioxide has been in scope since January 2024. Methane and nitrous oxide joined from 1 January 2026.
The phase-in is where people get caught out, because it is expressed by reporting year rather than by payment year. Shipping companies surrendered allowances in 2025 for 40 per cent of their 2024 emissions. The 2026 obligation covers 70 per cent of 2025 emissions. From 2027 the obligation reaches 100 per cent, which means emissions generated during calendar 2026 carry the full-rate surrender requirement.
A booking made today is a full-rate booking. Guidance describing the current surrender rate as 70 per cent is describing 2025 emissions. A voyage sailing now generates 2026 emissions, and those fall under the 100 per cent surrender requirement applying from 2027. Pricing a routing decision at 70 per cent understates it by nearly a third.
On who pays: the surrender obligation sits with the regulated shipping company, not the cargo owner. Whether the cost reaches you, and how, is a matter of the carrier’s pricing and your contract.
FuelEU Maritime sits alongside it under Regulation (EU) 2023/1805 and behaves differently. It regulates the intensity of the energy used rather than the volume, measured against the 2020 fleet average of 91.16 grams of carbon dioxide equivalent per megajoule, starting at two per cent from 2025 and reaching 80 per cent by 2050. A shortfall carries a penalty on the non-compliant energy, expressed per tonne of very low sulphur fuel oil equivalent, which is what a carrier’s compliance surcharge is built from.
Sailing further does not change a ship’s intensity, but it does increase the energy in scope, so a longer voyage scales the exposure in proportion. Transhipment matters too: the rules distinguish ports of call from certain transhipment stops and contain provisions for neighbouring container transhipment ports, which is one reason two services that look identical on paper do not carry the same carbon cost.
What this means if you are moving hardware
The routing comparison is usually presented as a procurement question. For technology hardware it is a compliance question first, because the thing that actually breaks is not the budget but the date.
- Plan against the range, not the midpoint. Seven to twelve days on North Europe and up to double that into the East Mediterranean. If your delivery commitment only survives the optimistic end, it is not a commitment.
- Check the licence window against the late date. Export licences, conformity certificates and some import permissions expire. A voyage that gains or loses two weeks can move a landing date past one of them, which is a compliance failure rather than a delay.
- Know which destination you are quoting. A Mediterranean site and a North European site are not the same planning problem, and the gap between them widens on the Cape.
- Ask who carries the emissions cost. It is a real line for EU-bound cargo and the answer depends on your contract, not on the regulation. On delivered duty paid terms it sits on our side of the line; our comparison of DDP against DAP sets out where the split falls.
- Price the fallback before you need it. For time-critical hardware that means a costed air option, covered in our note on Asia air cargo capacity in 2026, and a route for the urgent single line item through emergency spare parts customs clearance.
Which Incoterm you are trading on decides who absorbs most of this. Our guide to which Incoterm protects tech shipments sets out how DDP, DAP and CIF behave differently when a voyage changes shape, and carriers returning to the Red Sea covers why the routing you booked may not be the routing you sail.
How Carra Globe handles routing decisions
We provide importer of record and exporter of record services for technology hardware across 175+ countries, alongside freight forwarding, DDP customs clearance, warehousing and white glove delivery. Roughly 95 per cent of what we move goes by air, which is the lane companies reach for when an ocean routing stops being predictable.
On the ocean side our job is rarely to pick the route. It is to make sure the compliance calendar survives whichever route the carrier picks, whether that is a first shipment into a new country or one leg of a multi-country deployment. We check licence and certificate validity against the late arrival date rather than the advertised one, and we say so before a delivery date is agreed.
Carra Globe already holds the importer-side licences, certifications and approvals its local importing structures require for the goods we handle, so your cargo moves without delay at the border, with customs clearance in 1 to 2 business days. Our guide to how long customs clearance takes explains what moves that figure in either direction.
Importer of Record · Route Economics
The route decides the date. The date decides whether your licences are still valid.
Being clear about the boundary: we do not choose your ocean routing and we cannot change what a carrier decides. What we do is classify the shipment, check licence and certificate validity against the late arrival date rather than the advertised one, work out who carries the surcharge and emissions cost under your Incoterm, hold a costed air fallback for time-critical hardware, and tell you in writing where a diversion would break the date.
- Carriers returning to the Red Sea
- Strait of Hormuz closure 2026
- Ocean freight rates, October 2026
- Pay to play ocean freight
- When the freight bill beats the contract
- Which Incoterm protects tech shipments
- Asia air cargo capacity 2026
- Cargo insurance for IT equipment
- Supply chain resilience and compliance
- Importer of record services
- Exporter of record services
- IOR by country
Free tools HS Code Finder Volumetric Weight Calculator Pallet Calculator
Comparing routings on a hardware deployment? Send the origin, the destination and the date you have promised. We will tell you what each routing does to your licence windows and your delivery commitment, who carries the surcharge and emissions cost under your terms, and what an air fallback would cost.
Compare your routingFrequently asked questions
How many days does the Cape of Good Hope add to Asia to Europe?
Seven to twelve days one way on North Europe services, depending on the rotation and speed. Round trip measurements put it at about twenty days for West Europe and about 34 for the East Mediterranean.
How much further is the Cape route?
Shanghai to Rotterdam is about 10,600 nautical miles via Suez and 13,800 via the Cape. On Singapore to Rotterdam, UNCTAD puts Suez 29 per cent shorter, so the Cape is about 41 per cent further.
How much does a Suez Canal transit cost for a container ship?
It depends on the vessel’s Suez Canal Net Tonnage, which is not its published tonnage. Dues run on a regressive scale, with a 12 per cent surcharge added from 15 July 2026.
Is the Cape route cheaper than Suez?
On the International Transport Forum’s 2024 assumptions, no: 272 US dollars additional cost per 40ft container via the Cape against up to 160 via Suez. Those are not current 2026 prices.
Does the Suez Canal still offer a discount to container ships?
No. The 15 per cent rebate for ships of 130,000 SCNT and above was withdrawn early, effective 7 April 2026, and nothing has replaced it. A 12 per cent surcharge applies instead.
Does the Cape route increase EU carbon costs?
Yes, for a fixed set of European port calls. The extra distance sits on a leg that is in scope at 50 per cent, so half of the additional emissions carry an allowance cost.
Why is the Mediterranean penalty larger than North Europe?
A Cape-routed ship bound for the Mediterranean must pass Gibraltar and then sail back east. Sea-Intelligence measured Asia to Mediterranean transit times up about 39 per cent against 15 per cent for North Europe.
How much extra fuel does the Cape route burn?
About 2,000 tonnes per Asia to Europe round trip on the International Transport Forum’s basis, an increase of roughly 33 per cent at constant speed, and more where carriers speed up.
If your project depends on hardware landing inside a fixed window, the routing question and the compliance question are the same question. Our guides to importer of record for data centre equipment and data centre construction freight go into how that plays out on a build programme, and supply chain resilience and compliance covers designing for it in advance.
Sources and verification
- The cost comparison: the OECD’s International Transport Forum, The Red Sea Crisis: Impacts on Global Shipping and the Case for International Co-operation (2024), for the per-container comparison, the fuel and vessel figures and the stated assumptions. It is the only like-for-like total cost comparison we located from any official body, and it is 2024-vintage.
- Distance, time and capacity: UNCTAD, Navigating Troubled Waters (February 2024) for the Singapore to Rotterdam comparison, the greenhouse gas figure, the speed and fuel relationship and the India to Europe vessel example; UNCTAD Review of Maritime Transport 2025 for average haul and tonne-mile demand; and the World Bank for the distance range and the capacity absorbed.
- Lane distances: Port Economics, Management and Policy for Shanghai to Rotterdam and Shanghai to New York, at 16 knots without port calls. The Singapore to Rotterdam Cape distance is derived from UNCTAD’s 29 per cent statement applied to the published 8,440 mile Suez distance, and is labelled as derived. One widely circulated canal distance map pairs those figures inconsistently, so we have not relied on it. Asia to Mediterranean mileage pairs could not be verified and are not given.
- Transit time asymmetry: Sea-Intelligence minimum transit measurements against a pre-crisis baseline, and Sun, Abouarghoub, Demir and Potter in Transportation Research Part A, volume 203, January 2026, for the round trip durations. Both are commercial or academic rather than official, and are named rather than linked.
- Suez tolls: the Suez Canal Authority transit dues schedule for the Rate 7 container scale in force since 15 January 2024, and the authority’s navigation circulars index for circular 2 of 2026 on the 12 per cent surcharge and circular 3 of 2026 suspending the rebate introduced under circular 3 of 2025.
- Emissions: the European Commission on shipping in the EU Emissions Trading System for scope and phase-in, its maritime ETS questions and answers for ports of call and transhipment, and the Commission on FuelEU Maritime under Regulation (EU) 2023/1805.
- Verification note. Figures were checked on 26 September 2026. The cost comparison below is the 2024 edition because no later official version exists; this page will be updated if one is published. Three things we deliberately do not state: a dollar figure for a single Suez transit, because it turns on a tonnage measurement an importer cannot look up; Asia to Mediterranean distances in nautical miles, because no source we trust publishes the pair; and a shipper-side inventory carrying cost for the extra days, because no official body has quantified it. The authority’s own dues schedule contains no deck-stow threshold, so none is quoted here.
- This is not commercial or tax advice. Routing, surcharges, emissions liability and their allocation between parties are matters for your carrier, your forwarder and your own advisers.
Disclaimer: This guide is for informational purposes only and does not constitute legal, customs, insurance or regulatory advice. Tolls, surcharges, carbon prices and routing decisions change quickly, and the position described is as at 26 September 2026. Confirm the current position with the competent authority or a qualified adviser before acting.